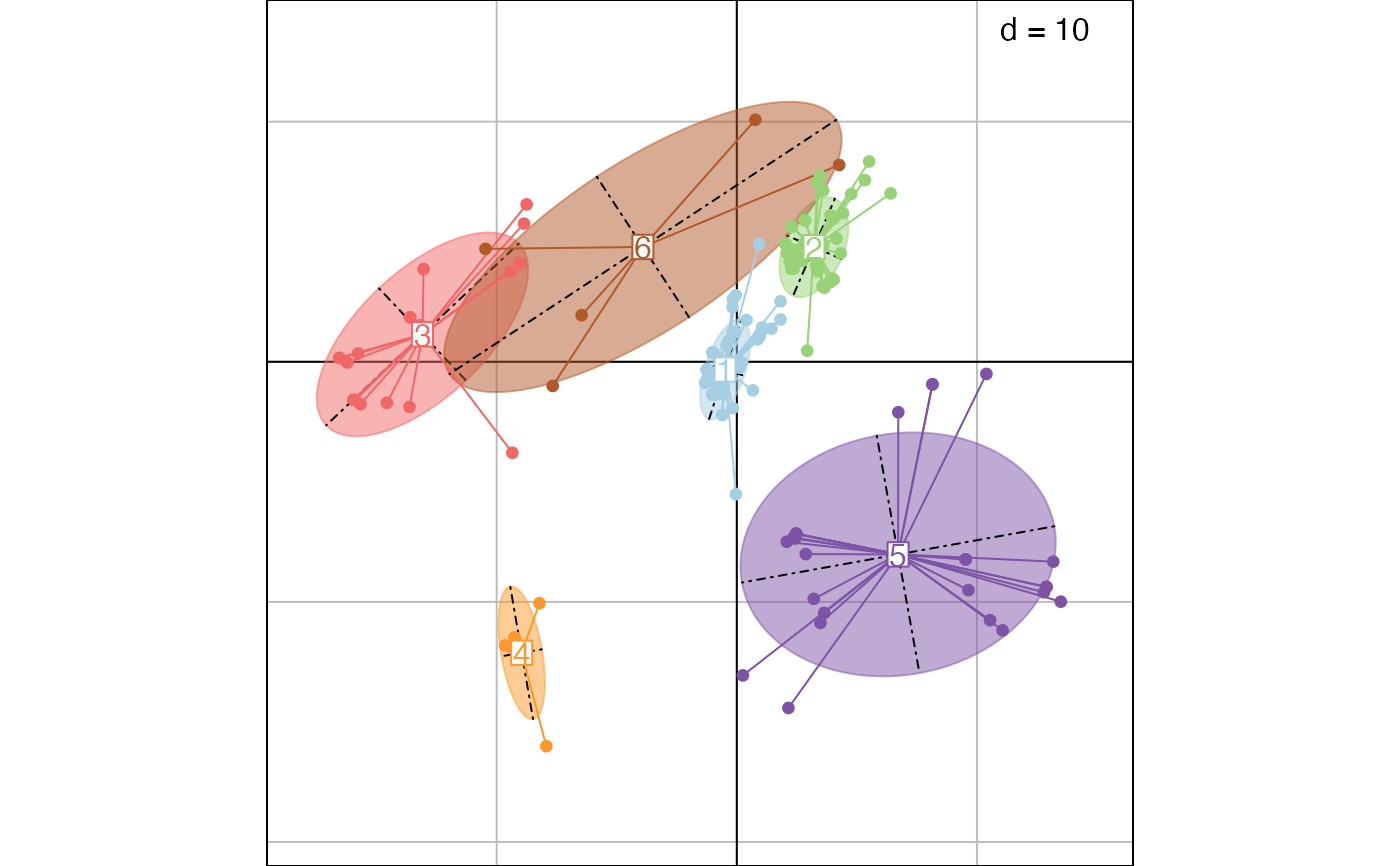
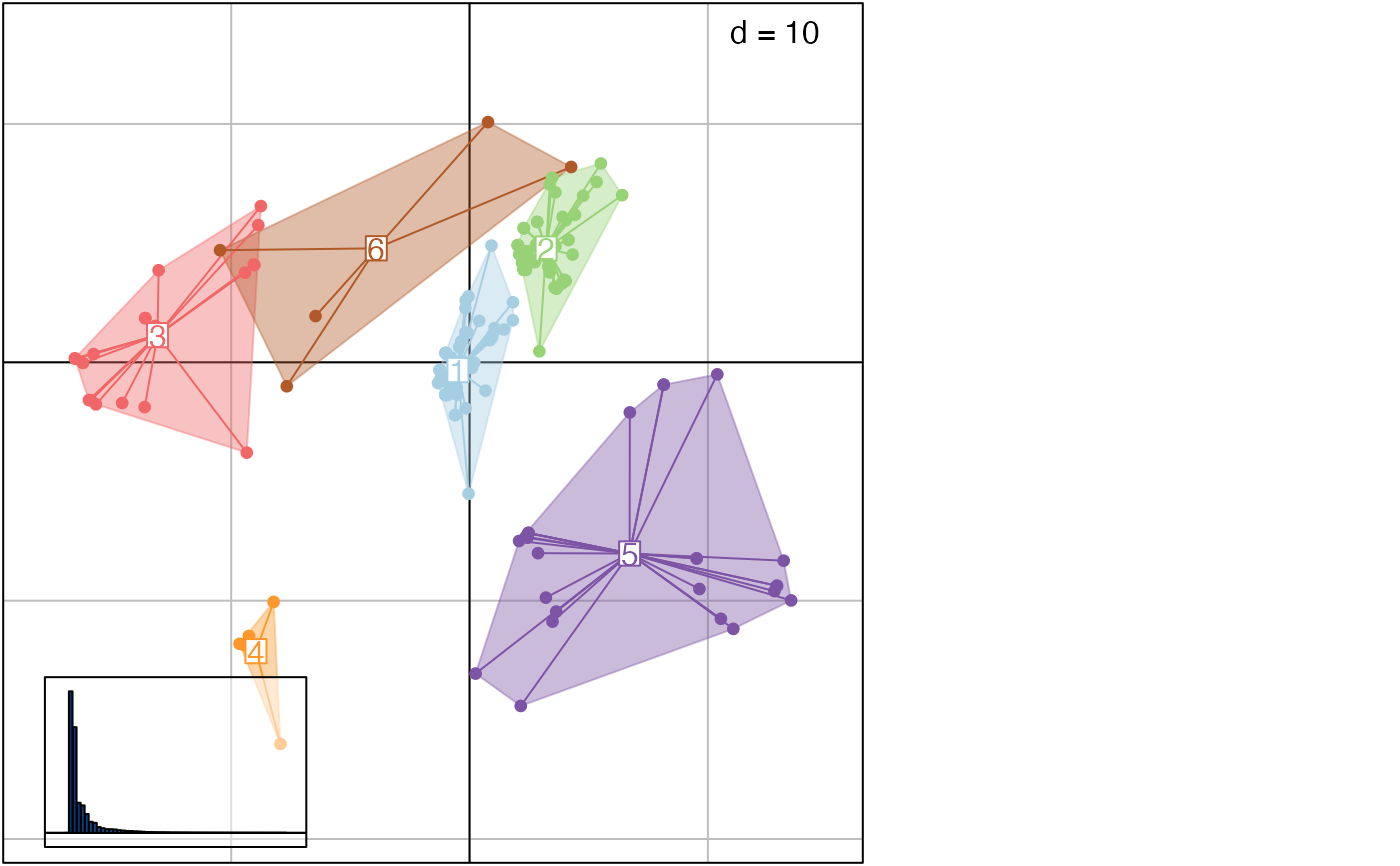
This function uses hierarchical clustering on principal components output by treespace to identify groups of similar trees. Clustering relies on hclust, using Ward's method by default.
findGroves(
  x,
  method = "treeVec",
  nf = NULL,
  clustering = "ward.D2",
  nclust = NULL,
  ...
)
Arguments
- x
an object of the class multiPhylo or the output of the function
treespace- method
(ignored if x is from
treespace) this specifies a function which outputs the summary of a tree in the form of a vector. Defaults totreeVec.- nf
(ignored if x is from
treespace) the number of principal components to retain- clustering
a character string indicating the clustering method to be used; defaults to Ward's method; see argument
methodin?hclustfor more details.- nclust
an integer indicating the number of clusters to find; if not provided, an interactive process based on cutoff threshold selection is used.
- ...
further arguments to be passed to
treespace
Value
A list containing:
groups: a factor defining groups of trees
treespace: the output of treespace
See also
plotGroves to display results
Examples
if(require("adegenet") && require("adegraphics")){
## load data
data(woodmiceTrees)

## run findGroves: treespace+clustering
res <- findGroves(woodmiceTrees, nf=5, nclust=6)

## plot results on first 2 axes
PCs <- res$treespace$pco$li
s.class(PCs, fac=res$groups, col=funky(6))

## using plotGroves
plotGroves(res)
}
#> Loading required package: adegenet
#>
#>    /// adegenet 2.1.11 is loaded ////////////
#>
#>    > overview: '?adegenet'
#>    > tutorials/doc/questions: 'adegenetWeb()'
#>    > bug reports/feature requests: adegenetIssues()
#>
#>
#> Attaching package: ‘adegenet’
#> The following object is masked from ‘package:treespace’:
#>
#>     .render.server.info
#> Loading required package: adegraphics
#>
#> Attaching package: ‘adegraphics’
#> The following objects are masked from ‘package:ade4’:
#>
#>     kplotsepan.coa, s.arrow, s.class, s.corcircle, s.distri, s.image,
#>     s.label, s.logo, s.match, s.traject, s.value, table.value,
#>     triangle.class
#> The following object is masked from ‘package:ape’:
#>
#>     zoom

